I'm so excited that following about seven months of work "skimr" an R package for summarizing data has been released! It's based on idea from Amelia McNamara for a "frictionless, pipeable approach to dealing with summary statistics." Like me, Amelia teaches introductory statistics to undergraduates, and I could immediately see where she was going with the idea for both students and researchers.
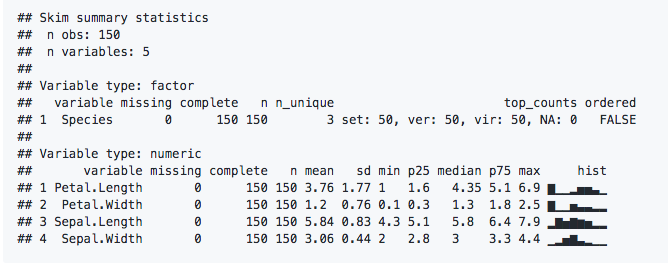
The thing that excites people the most about skimr is when they see the inline histograms (aka spark graphs) which is definitely cool. In fact it was so exciting that even Edward Tufte tweeted about it a few times, first because he liked the spark graphs, then because he didn't like how we were handling (actually not handling) decimals. As Michael Quinn tweeted: "Omg. Omg. Omg. Ed Tufte made fun of me on Twitter. Life complete." As you can see below the whole thing worked out and we're not showing 9 decimals any more (unless you change the formats).
Amazingly the first StackOverflow question about skimr was posted on May 30, and it's been kind of a wild ride ever since, with over 300 stars and a steady but not overwhelming stream of issues and pull requests.
So, how did this happen?
Last Spring I saw a tweet about the ROpenSci Unconference and how great it was. I had been paying attention to the ROpenSci project on and off for a while, but it always had seemed not to have much in the way of social science. However, this time when I looked at the site it was a lot bigger and broader and even had a history package. So I took a deep breath and filled out the application saying something like "you don't have any sociologists, and you should." I had no idea what the chances were but next thing I knew I was talking with their excellent community manager Stefanie Butland in a pre unconf interview.
One of the cool and somewhat intimidating things about ROpenSci is that even though I had met essentially no one before (ok I saw Hadley give a talk once), I knew people from using their packages and #rstats on Twitter. Still it was intimidating, first of all, lots of people with packages, Ph.D.s in statistics, and all kinds of really amazing science work. I was especialy excited that Sean Kross was going to be there since I use his Swirl package constantly in my class, and we'd emailed back and forth some.
The unconference was really amazing, and unlike anything I've attended. People have already blogged about the process elsewhere, but essentially by lunch on day one we had broken up into self-organized groups of different sizes (from 1 to maybe 8) and were working on projects. And then, more or less people worked on those projects (though some individuals switched up or finished their first projects quickly) for the rest of the time through to the presentation at the end. So it was kind of like a hackathon, but with better food, no prizes, not staying up all night and almost everyone with a Ph.D. or in a doctoral program. And lots of women. So, not really like a hackathon.
I've been on kind of an extended vacation from group coding for a couple of years, but it really brought back for me how much fun it can be to be white boarding and coding with others, especially when the group is positive and open. Okay, I'm just going to say it, it's the first time I've ever really worked on code in a group that was half women and that was just amazing, especially when reflecting afterwards on what made it so different from past experiences. But more about that another time.
People in our group came with wildly different backgrounds, and I feel everyone was trying and learning new things. For example, a lot of us learned a lot more about unit testing in R and particularly using the testthat package. I feel like I really came to understand S3 methods. Other people learned to think about code style, mastering git, package structure, and how "stats 101 students" think. Over the two days we moved pretty quickly from prototype to a fairly polished first version. For me it was great to be using the muscles you need for a public facing project again, and how that creates a different kind of code practice and attention to detail and the big picture.
I really like skimr and it clearly was of interest, so I kept working on it as did Michael Quinn. Over the summer and fall we did some refactoring and ironed out some issues, wrote up vignettes, got to 100% test coverage and overall continued to make good progress on it. A few weeks ago we realized that we had just a few things to do before we were ready to give CRAN a try. We got those done, and here we are. There is still at least one outstanding item, which is coming up with a reasonable approach to rendering the spark graphs on Windows. Still, here we are.
I've been saying to various people for the past couple of weeks "you know it changes when you have users" and that is definitely true. I do feel like I see a fairly high abandonment rate of R packages especially when they are Github only. But I also feel like we're ready and we have a good idea of what is in and out of scope for this project. Also the #rstats community and definitely the community of people doing science with R are really great. So I'm committed to being a good CRAN project maintainer.